Anymap js maps
Download URL | Author URL | Software URL | Buy Now ($79)
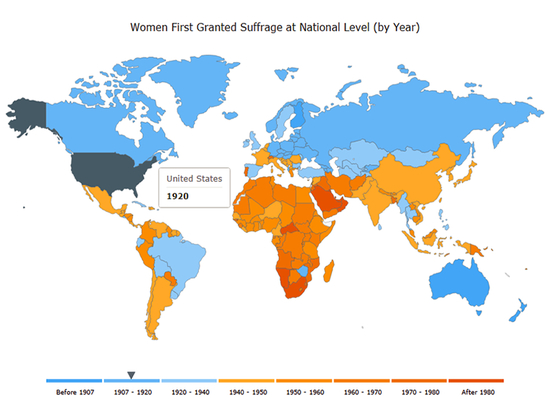
AnyMap JS Maps is an advanced JavaScript/HTML5 mapping library which makes you able to easily create interactive maps that look great on any device including PCs, Macs, iPhones, iPads, Android devices and others - on any platform and in any browser.
AnyMap JS is perfect for interactive dashboards and side-by-side reporting. You can use it to display sales by region, election results, weather forecast, population density, and any other geo-related data.
AnyMap JS comes with our ready-to-use Map Collection which you can use at no additional cost. Maps are supplied in GeoJSON, which makes them flexible in working and editing. Custom maps can be created from any SHP map.
AnyMap JS maps are fully compatible with other AnyChart JS Charts' HTML5 charting solutions - AnyChart JS (basic JavaScript charts), AnyStock JS (date/time JavaScript/HTML5 charts, e.g. financial and stock charts that visualize real-time data), and AnyGantt JS (JavaScript/HTML5 Gantt charts), and can be used both in a d
Related software (5)

AnyGantt JS Gantt Charts
AnyGantt is a flexible, cross-platform and cross-browser JavaScript charting library that allows you to easily build smart HTML5 Gantt Charts and utilize the power of animation and ...

AnyChart JS Charts and Dashboards
AnyChart is a flexible, cross-platform/browser, dependency-free JS chart library for adding interactive bar, area, pie, column, spline, scatter, line, gauge, treemap, funnel, spark ...

AnyMap JS Maps
AnyMap JS Maps is an advanced JavaScript-HTML5 mapping library with the ever-expanding Map Collection, which makes you able to easily create interactive maps looking great on PCs, ...

AnyStock Stock and Financial JS Charts
AnyStock Stock and Financial JS Charts is a flexible JavaScript charting library to visualizing large data sets in interactive HTML5 charts. Designed to display date/time informati ...

AnyChart JS Charts and Dashboards
AnyChart is a flexible, cross-platform/browser, dependency-free JS chart library for adding interactive bar, area, pie, column, spline, scatter, line, gauge, treemap, funnel, spark ...
