Graph
Download URL | Author URL | Software URL | Buy Now ($0)
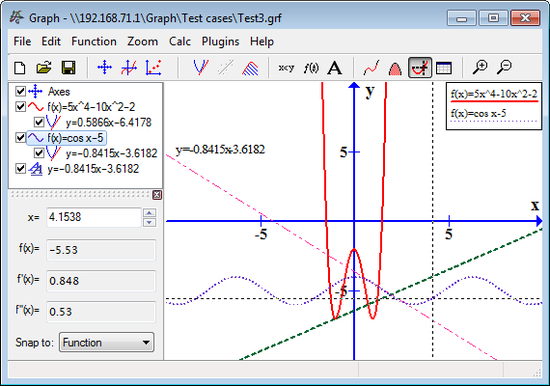
This program is for drawing graphs of mathematical functions in a coordinate system. Graphs may be added with different color and line styles. Both standard functions, parameter functions and polar functions are supported. It is possible to evaluate a function at an entered point or tracing the function with the mouse. It is possible to add shadings to functions, and series of points to the coordinate system. Trendlines may be added to point series.
It is possible to save the coordinate system and everything on it as an image file. It is also possible to copy an image into another program. Text labels may be placed anywhere in the coordinate system.
Related software (5)

Advanced Graph and Chart Collection
Add Powerful reporting features to your Web / Intranet pages and applications. With the advanced graphing package you will be quickly adding impressive dynamic charting capabilitie ...

Mihov DPI to Pixel Calculator
Mihov DPI to Pixel Calculator is made for calculating DPI and desired size to Pixels. You can enter desired size in inches or centimeters. It is a program for calculating pixels fr ...

GraphSketcher
GraphSketcher is a professional graphics designer editor. The one thing I couldn't get it to do was curves. The feature list does say that it supports 'curved paths,' but I could ...

Advanced Graphs and Charts for PHP
The PHP graphing scripts provide a very easy way to embed dynamically generated graphs and charts into Applications and Web pages. Easy to use and create professional quality graph ...

GraphInquire ActiveX
The GraphInquire ActiveX provides a Microsoft Chart element with special functionality to inquire the exact form of a series by zoom in, zoom out and scrolling and to display sever ...
